

Course ID: BIO2003/BIO2005/BMS2007/BMS2075/BMS2475
Introduction
The UK’s Committee on Toxicity of Chemicals in Food launched a research that investigates levels of BPA in two different fruit juice carton packaging techniques (A and B), both using cardboard coated with processes involving BPA. In order to test whether the fruit juice quality was adversely affected by the packaging process, an experiment was undertaken comparing the level of BPA from the same batch of fruit juice which was randomly allocated to cartons made using the two techniques. A total of 67 cartons of fruit juice were prepared, 36 using method A and 31 using method B. After being kept in identical conditions (same time, same size/shaped carton, same volume of fruit juice), the cartons were opened and the fruit juice analysed for BPA using High Performance Liquid Chromatography (HPLC) via the agency of an accredited analytical chemistry laboratory.
The experimental hypothesis was that BPA was leaching out of the packaging material and entering the fruit juice and that there would be a difference between the two packaging processes with respect to the BPA level.
Problem
The following report aims at conducting hypothetical test with respect to levels of Bisphenol A (BPA) [IUPAC name 4,4'-(propane-2,2-diyl)diphenol] which is a chemical that is widely used in the manufacture of inert coatings of many types of food packaging. In concentrated form, there is evidence that BPA has hormone-like properties e.g. mimicking oestrogen. This has raised concerns about its presence in consumer products.
The Committee needs to know what is the evidence, based on the level of BPA in the fruit juice, whether there is a significant difference between the two carton packaging processes.
Dataset
The data comprises of 67 analysed packages of fruit juice. Three variables are presented below: the sample identifier number, the BPA concentration (in µg/L), and the type of packaging process/method. The data table is available as appendix.
Statistical Testing
The above mentioned scenario comprises of two types of methods of packaging: A and B. The provided data comprises of BPA levels in each fruit package under either type of methods. Hence, in order to compare the level of BPA in Method A as compared to Method B, we need to use a statistical test to compare means.
The selected test is T-test for Two Independent Means. This is because the test involves two datasets or samples: method A and Method B. Further, the data observations for each of the method is independent of each other. Hence, the test can be used.
Assumptions of the Selected Test
Before the T-test for Two Independent Means can be used, the dataset needs to be checked if it meets the assumptions for the test. Following are the assumptions for a T-test for Two Independent Means:
1. Normal Distribution: The selected test assumes that the dependent variable is approximately normally distributed within each group. Hence, in the given scenario, we need to test if the BPA levels in juice packages are normally distributed (approximately) for each of the Method A and Method B. This can be done by creating histogram for the data under each of the method. The output is as follows: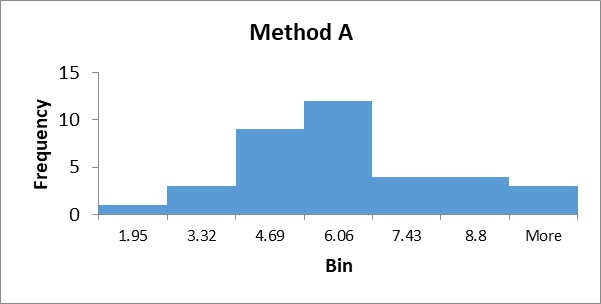

It can be seen that both the sample datasets are approximately normally distributed. The group sizes are also similar at 36 observations under Method A and 31 observations under Method B.
2. Homogeneity of Variance: The selected test also assumes that the variances are homogeneous in nature. For testing the homogeneity of variance, F-Test for two sample variances was conducted as follows:
It can be seen that the p-value of 0.2854 is way higher than assumed significance level of 0.05. Hence, we can say that we do not have sufficient evidence to reject the null hypothesis. Hence, the variances of the two data sets are homogeneous.
Conducting the Selected Test
In the above section, we checked that the assumptions required for conducting a t-test for two independent means are being satisfied in the given scenario of 67 juice packages packed through either Method A or Method B. Now, we can conduct the t-test to compare the mean BPA level in juice package packed through Method A and the mean BPA level in juice package packed through Method B.
The hypothesis for the test is as follows:
The significance level is:
We need to assume a significance level such that the statistical test can be concluded. Hence, we assume an alpha of α = 0.05. This indicates that the certainty that the test conclusion is true is 95%.
The actual test was conducted using the inbuilt data tools in Microsoft Excel. The test output is as follows:
| t-Test: Two-Sample Assuming Equal Variances | ||
| [BPA] µg/L Method A | [BPA] µg/L Method B | |
| Mean | 5.519 | 6.572 |
| Variance | 4.010 | 3.267 |
| Observations | 36 | 31 |
| Pooled Variance | 3.667 | |
| Hypothesized Mean Difference | - | |
| Df | 65.000 | |
| t Stat | -2.245 | |
| P(T<=t) one-tail | 0.014 | |
| t Critical one-tail | 1.669 | |
| P(T<=t) two-tail | 0.028 | |
| t Critical two-tail | 1.997 |
From above, it can be seen that the calculated t-stat is 2.245. Also, the two-tailed p-value is 0.028.
Now, if the p-value is lower than the assumed significance level, then we have sufficient statistical evidence to reject the null hypothesis. However, if the p-value is higher than the assumed significance level, then we do not have sufficient evidence to reject the null hypothesis.
From the above output, it can be seen that the p-value of 0.028 is lower than the assumed significance level of 0.05. Hence, we have evidence to reject the null hypothesis.
The statistical test conclusion is:
Since the p-value was lower than the assumed significance level, we have sufficient evidence to reject the null hypothesis.
Hence, we can conclude that the mean level of BPA in juice packages packed under method A vary significantly from the mean level of BPA in juice packages packed under Method B. It also seems that the mean BPA level of BPA in juice packages packed under method A is lower than the mean level of BPA in juice packages packed under Method B.
Appendix
BPA concentrations (µg/L) in fruit juice following packaging by two methods
ID [BPA] µg/L Method
19.49A
25.50A
35.59A
43.47A
55.87A
66.05A
79.17A
81.95A
92.79A
108.21A
115.33A
124.43A
134.84A
143.94A
152.22A
164.41A
175.26A
185.55A
194.39A
204.47A
216.39A
224.45A
236.19A
244.09A
258.39A
265.89A
276.82A
285.44A
297.47A
301.98A
316.58A
324.15A
335.34A
347.63A
3510.17A
364.77A
373.27B
3810.24B
393.89B
408.49B
415.91B
426.71B
435.54B
447.88B
453.62B
467.75B
475.46B
486.94B
497.36B
506.41B
517.60B
524.73B
534.95B
546.33B
559.41B
563.79B
577.64B
587.72B
597.78B
606.30B
617.81B
627.50B
635.61B
643.95B
659.72B
667.14B
676.29B
Introduction
The UK’s Committee on Toxicity of Chemicals in Food launched a research that investigates levels of BPA with respect to two packaging techniques used for packing fruit juice cartons. The common factor for both the packaging techniques is that the cardboard coating comprises of BPA. The BPA is suspected to leach out from the material and enter the fruit juice contents and since BPA is known to have multiple harmful effects, the situation is serious.
To test whether there is difference in BPA levels in fruit juice packaged through different packaging techniques, a batch of 67 fruit juice cartons was distributed in a random manner to either packaging techniques out of Technique A and Technique B. All the packed cartons were kept in exactly same situations (time, size, shape, volume etc. being same). Then the cartons were opened, and sample of fruit juice was taken from each of the 67 cartons. The level of BPA was checked using High Performance Liquid Chromatography (HPLC) through the agency of an accredited analytical chemistry laboratory.
Problem
The following report aims at conducting hypothetical test with respect to levels of Bisphenol A (BPA) [IUPAC name 4,4'-(propane-2,2-diyl)diphenol] which is a chemical that is used extensively for the production of inert coatings of several different food packaging. When highly concentrated, BPA is known to mimic hormone-like properties and hence, there are concerns if it is present in consumer products.
The report will be performing hypothetical testing to analyse if there is significant difference in level of BPA in fruit juice from cartons packed through packing technique A versus packing technique B.
Dataset
The data comprises of 67 analysed packages of fruit juice with three variables being the sample identifier number, the BPA concentration (in µg/L), and the type of packaging process/method. The data table is available as appendix.
Statistical Testing
The above mentioned scenario comprises of two types of methods of packaging: A and B. The provided data comprises of BPA levels in each fruit package under either type of methods. Hence, in order to compare the level of BPA in Method A as compared to Method B, we need to use a statistical test to compare means.
The selected test is T-test for Two Independent Means. This is because the test involves two datasets or samples: method A and Method B. Further, the data observations for each of the method is independent of each other. Hence, the test can be used.
Assumptions of the Selected Test
Before the T-test for Two Independent Means can be used, the dataset needs to be checked if it meets the assumptions for the test. Following are the assumptions for a T-test for Two Independent Means:

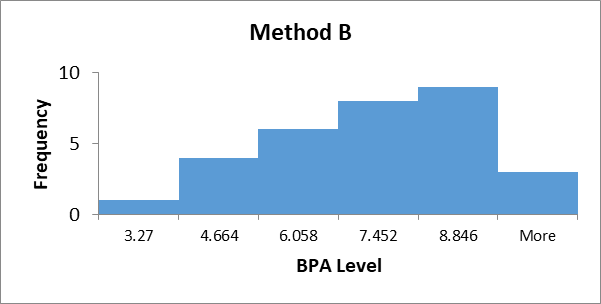
It can be seen that both the sample datasets are approximately normally distributed. The group sizes are also similar at 36 observations under Method A and 31 observations under Method B.
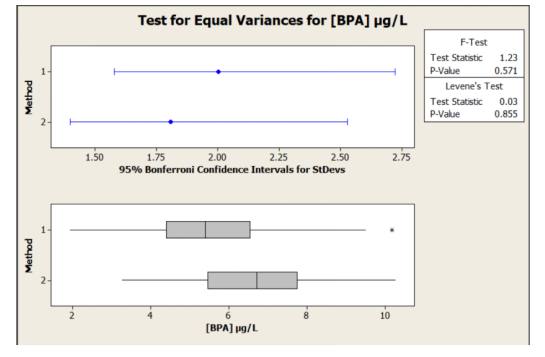
It can be seen that the p-value of F-Test is 0.571 and p-value of Levene’s Test is 0.855 and both are way higher than assumed significance level of 0.05. Hence, we can say that we do not have sufficient evidence to reject the null hypothesis. Hence, the variances of the two data sets are homogeneous.
Conducting the Selected Test
In the above section, we checked that the assumptions required for conducting a t-test for two independent means are being satisfied in the given scenario of 67 juice packages packed through either Method A or Method B. Now, we can conduct the t-test to compare the mean BPA level in juice package packed through Method A and the mean BPA level in juice package packed through Method B.
The hypothesis for the test is as follows:
The significance level is:
We need to assume a significance level such that the statistical test can be concluded. Hence, we assume an alpha of α = 0.05. This indicates that the certainty that the test conclusion is true is 95%.
The actual test was conducted using the two-sample t-test in Minitab. The test output is as follows: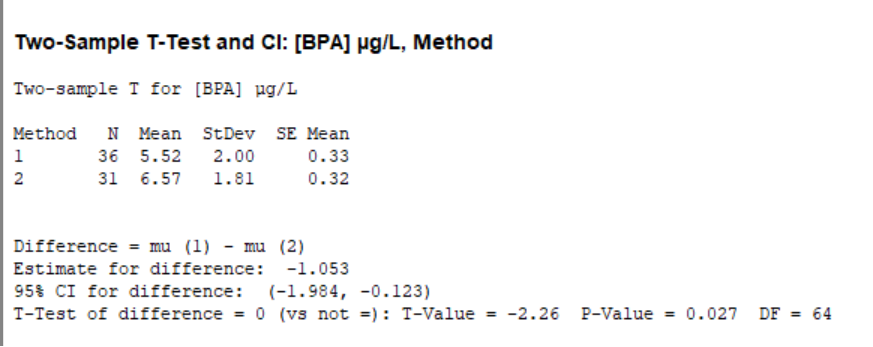
From above, it can be seen that the calculated t-stat is -2.26. Also, the two-tailed p-value is 0.027.
Now, if the p-value is lower than the assumed significance level, then we have sufficient statistical evidence to reject the null hypothesis. However, if the p-value is higher than the assumed significance level, then we do not have sufficient evidence to reject the null hypothesis.
From the above output, it can be seen that the p-value of 0.027 is lower than the assumed significance level of 0.05. Hence, we have evidence to reject the null hypothesis.
The statistical test conclusion is:
As the p-value was lower than the anticipated significance level, we have adequate evidence to reject the null hypothesis.
Hence, it is clear that the mean level of BPA in juice packages packed under method A vary significantly from the mean level of BPA in juice packages packed under Method B. It also seems that the mean BPA level of BPA in juice packages packed under method A is lower than the mean level of BPA in juice packages packed under Method B.


 Pages: 4
 Words: 890